Data Analysis
Experience in gathering, sourcing, cleaning and analyzing various U.S. datasets. Proficient in R, SQL, Python, familiar with data science concepts and methods.
Working at Bloomberg Industry Group. Trained by Missouri School of Journalism and National Institute for Computer-Assisted Reporting (NICAR) data library.
I specialize in identifying patterns in data and translating ideas concisely into visuals. I'm passionate about learning new things and always seek to grow as a person.
I'm a life-long learner driven by curiosity and creativity.
I like cooking, reading, swimming, nature, and spending time with my cats.
Reading Designing Your Life.

Experience in gathering, sourcing, cleaning and analyzing various U.S. datasets. Proficient in R, SQL, Python, familiar with data science concepts and methods.
Ability to translate data points to concise visualizations that drives the message home. Proficiency in Adobe Illustrator, Flourish, and Tableau.
Certificate in JavaScript Development course from General Assemly, a 11-week instroctor-led and projects-driven program covering events, DOM, APIs, GitHub, CRUD, Firebase, and React.
Skills in developing sources, conducting interviews, filing public information requests, backgrounding, investigative reporting, and news writing.

R I saw government agency names as employers in data about H1B - the visa program blamed by former administration to steal jobs from Americans - and had to ask how many H1B workers the administration was hiring. I found that more than 2,000 workers had been approved for Fiscal Year 2019.
Dateline Award, Society of Professional Journalists, DC chapter | Finalist in Features
Front Page Award, Washington-Baltimore News Guild | Honorable Mention in National Reporting on Immigration
R, Google Workspace, Flourish I designed and managed the data collection efforts on over 100 federal courts' operations, created an interactive map, and updated the map daily based on the most updated data with an R script, rendering Bloomberg Law the source of most comprehensive information on federal courts' operations under Covid-19 pandemic. Lawyers, judges and even the Office of U.S. Courts used our reporting as reference. A series of stories were driven by this data, including this story that scooped the U.S. Courts and this weekly blog.

R, Shiny Dashboard, Adobe Illustrator The story revealed the requests by five global automakers to be exempted from the tariffs imposed on Chinese goods by the Trump administration. The story was made possible by a Shiny Dashboard I co-built that scrapes data from regulations.gov and automates analysis. I also made the graphics in Adobe Illustrator.
Beltz Award for Editorial Excellence, Bloomberg Industry Group

R The story shows how California cities' sales and use tax revenues are at mercy of a change in Amazon's corporate structure. I analyzed the data, found use tax trend reversing corresponding to Amazon's structural change, which underpinned the story. I also identified visual opportunities and mocked up the graphics in R.
R, Google Workspace, Flourish I guided the process of data collection and updating in Google Sheet and R, introduced external data points, analyzed the data and built an interactive in Flourish that allows the readers to explore the relationship between different data points and generate insights themselves.
Azbee Award of Excellence, Mid-Atlantic Region| Bronze Award in Data Journalism
R, Shiny Dashboard, Flourish I built a shiny R dashboard for the beat reporters and editors to explore the dataset. The insights they found from the dashboard made this story possible. I also created an interactive graphic in Flourish that showcases the findings, which mimics my dashboard.
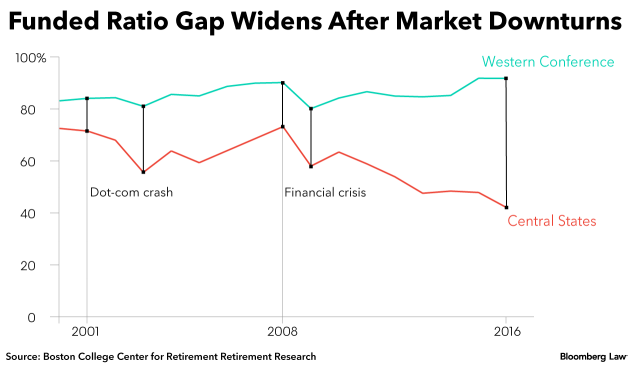
Adobe Illustrator, reporting The story dives into data to reveal how two of the largest pension plans of the same union have had different fates - one about to run out of money to pay its members, while the other does well financially. I talked to sources, did research, collected the data, and wrote the story; I also made the graphics with Adobe Illustrator.
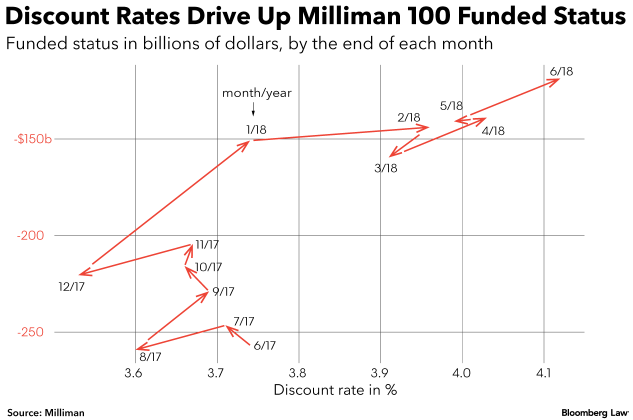
R I translated a table of numbers into a graphic that shows a trend that was hard to grasp just by looking at numbers. Graphic generated in R and styled with Adobe Illustrator.
JavaScript A website that renders a Google Map with shelter location markers and shelter information pop-ups based on location and distance search. Built with Google Maps API and Petfinder API. I was able to piece together what was unclear from the API documentations from tutorials and Google search. Through this project I gained confidence and improved my problem-solving skills

React, D3 Created a face of panda using React, D3, SVG elipse, circle, and path elements
Initiative, Ability to Learn, Source-building When I spotted a gap in coverage on blockchain, I took online classes, built sources, quickly became the in-house expert and generated a series of cutting-edge stories.

Automated contract drafting, self-executing legal agreement could save time, lower cost. Blockchain can confirm the existence and authenticity of legal documents, reduce disputes

The number of blockchain-related job postings on LinkedIn increased fourfold in 2017. Certification programs and online courses are filling the gap in blockchain education.

Prudential and Fidelity among early explorers of blockchain technology. Blockchain technology is said to provide better transparency for pension plans.

Peer-to-peer gig platforms like Uber are emerging on blockchain. Survey shows increase in freelancers, predicts majority of U.S. workers will be freelancing by 2027. Blockchain, allowing easy contracting and payment, could accelerate the shift toward freelancing.

Some U.S. companies are paying international workers in bitcoins, while sSome employers offer wage option in cryptocurrency as a benefit. Cryptocurrency payment could benefit workers and employers, sources say.

Bitcoin futures allow exposure to bitcoin without holding it, opening door for pension funds. Prudent investment and fiduciary rules prevent pension funds from going into volatile new asset. Cryptocurrency market volume still small, could be manipulated more easily than other asset classes.